|
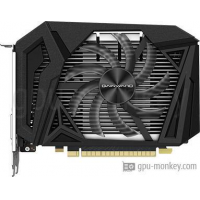
Gainward GeForce GTX 1650 SUPER Pegasus OC
Gainward GeForce GTX 1650 SUPER Pegasus OC lanzó Q4/2019 , que se basa en la arquitectura NVIDIA GeForce GTX 1650 SUPER Vendrá con 4 GB de alto ancho de banda GDDR6 memoria.El Gainward GeForce GTX 1650 SUPER Pegasus OC cuenta con 1280 shader, 32 unidades de salida de renderizado, tiene un reloj de impulso de 1.770 GHz+ 3 % y está equipado con un consumo de energía de 100 W . La GPU admite hasta 3 monitores con resoluciones de 3840x2160 . Además, si usted está buscando Air cooling más fresco y Axial tipo abanico, que sería su mejor opción. |
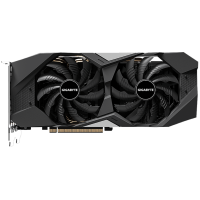
GIGABYTE GeForce RTX 2070 Windforce 2X 8G (rev. 3.0)
GIGABYTE GeForce RTX 2070 Windforce 2X 8G (rev. 3.0) lanzó Q4/2019 , que se basa en la arquitectura NVIDIA GeForce RTX 2070 Vendrá con 8 GB de alto ancho de banda GDDR6 memoria.El GIGABYTE GeForce RTX 2070 Windforce 2X 8G (rev. 3.0) cuenta con 2304 shader, 64 unidades de salida de renderizado, tiene un reloj de impulso de 1.620 GHz y está equipado con un consumo de energía de 175 W . La GPU admite hasta 4 monitores con resoluciones de 7680x4320 . Además, si usted está buscando Air cooling más fresco y Axial tipo abanico, que sería su mejor opción. |
|
GPU |
||
| NVIDIA GeForce GTX 1650 SUPER | Based on | NVIDIA GeForce RTX 2070 |
| TU116-250-KA-A1 | GPU Chip | TU106 |
| 20 | Unidades de ejecución | 36 |
| 1280 | Sombreador | 2304 |
| 32 | Render Output Units | 64 |
| 80 | Texture Units | 144 |
Memory |
||
| 4 GB | Memory Size | 8 GB |
| GDDR6 | Memory Type | GDDR6 |
| 1.5 GHz | Memory Speed | 1.75 GHz |
| 192 GB/s | Memory Bandwith | 448 GB/s |
| 128 bit | Memory Interface | 256 bit |
Clock Speeds |
||
| 1.530 GHz | Base Clock | 1.410 GHz |
1.770 GHz + 3 % + 3 % |
Boost Clock | 1.620 GHz |
| 1.725 GHz | Avg (Game) Clock | |
|
Yes |
overclocking |
Yes |
Thermal Design |
||
| 100 W | TDP | 175 W |
| -- | TDP (up) | -- |
| -- | Tjunction max | -- |
| 1 x 6-Pin | PCIe-Power | 1 x 8-Pin |
Cooler & Fans |
||
| Axial | Fan-Type | Axial |
| 1 x 100 mm | Fan 1 | 2 x 100 mm |
| -- | Fan 2 | -- |
| Air cooling | Cooler-Type | Air cooling |
| -- | Noise (Idle) | 0 dB / Silent |
| -- | Noise (Load) | -- |
Connectivity |
||
| 3 | Max. Displays | 4 |
| 2.2 | HDCP-Version | 2.2 |
| 1x HDMI v2.0b | HDMI Ports | 1x HDMI v2.0b |
| 1x DP v1.4 | DP Ports | 3x DP v1.4a |
| 1 | DVI Ports | -- |
| -- | VGA Ports | -- |
| -- | USB-C Ports | -- |
Featureset |
||
| 3840x2160 | Max. resolution | 7680x4320 |
| 12_1 | DirectX | 12_2 |
| No |
Raytracing | Yes |
| No |
DLSS / FSR | Yes} |
| No LED lighting | LED | No LED lighting |
Supported Video Codecs |
||
| Decode / Encode | h264 | Decode / Encode |
| Decode / Encode | h265 / HEVC | Decode / Encode |
| No |
AV1 | No |
| Decode | VP8 | Decode |
| Decode | VP9 | Decode |
Dimensions |
||
| 168 mm | Length | 265 mm |
| 126 mm | Height | 121 mm |
| -- | Width | -- |
| 2 PCIe-Slots | Width (Slots) | 2 PCIe-Slots |
| -- | Weight | -- |
| PCIe 3.0 x 16 | Interfaz GPU | PCIe 3.0 x 16 |
Additional data |
||
| NE6165SS18G1-166F | Part-no | GV-N2070WF2-8GD |
| Q4/2019 | Fecha de lanzamiento | Q4/2019 |
| -- | Precio de lanzamiento | -- |
| 12 nm | Tamaño de la estructura | 12 nm |
| data sheet | Documents | data sheet |