GET FREE $100 Welcome Offer
BUY AND SELL BTC, BNB, CAKE, DOGE, ETH AND 27 MORE
BUY AND SELL BTC,
BNB, CAKE, DOGE
ETH AND 27 MORE

INNO3D GeForce RTX 2080 Ti JET - Benchmark, prueba de comparación y especificaciones


INNO3D GeForce RTX 2080 Ti JET

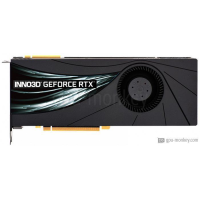
INNO3D GeForce RTX 2080 Ti JET lanzó , que se basa en la arquitectura NVIDIA GeForce RTX 2080 Ti Vendrá con 11 GB de alto ancho de banda GDDR6 memoria.El INNO3D GeForce RTX 2080 Ti JET cuenta con 4352 shader, 88 unidades de salida de renderizado, tiene un reloj de impulso de 1.545 GHz y está equipado con un consumo de energía de 250 W . La GPU admite hasta 4 monitores con resoluciones de 7680x4320 . Además, si usted está buscando Air cooling más fresco y Radial tipo abanico, que sería su mejor opción.

GPU and Memory GPU and Memory
Based on NVIDIA GeForce RTX 2080 Ti Memory Size 11 GB
GPU Chip TU102 Memory Type GDDR6
Unidades de ejecución 68 Memory Speed 1.75 GHz
Sombreador 4352 Memory Bandwith 616 GB/s
Render Output Units 88 Memory Interface 352 bit
Texture Units 272
Compatibilidad con códecs de hardware Compatibilidad con códecs de hardware
H264 Decode / Encode
H265 / HEVC (8 bit)
H265 / HEVC (10 bit)
VP8 Decode
VP9 Decode
AV1 No
AV1 No
AVC
JPEG
Velocidades de reloj
Base Clock 1.350 GHz
Boost Clock 1.545 GHz
Avg (Game) Clock
overclocking Yes check

Diseño Térmico
TDP 250 W
TDP (up) 285 WDeviation vs GPU group-11 %
Tjunction max --
PCIe-Power 2 x 8-Pin
Enfriador y ventiladores
Fan-Type Radial Cooler-Type Air cooling
Fan 1 1 x 75 mm Noise (Idle) 0 dB / Silent
Fan 2 -- Noise (Load): --
Conectividad
Max. Displays 4
HDCP-Version 2.2
HDMI Ports 1x HDMI v2.0b
DP Ports 3x DP v1.4a
DVI Ports --
VGA Ports --
USB-C Ports 1
Conjunto de características
Max. resolution 7680x4320
DirectX 12_2
Raytracing Yes check
DLSS / FSR Yes check
LED No LED lighting
Códecs de vídeo compatibles
h264 Decode / Encode VP8 Decode
h265 / HEVC Decode / Encode VP9 Decode
AV1 No uncheck Noise (Load): --
Dimensiones
Length 268 mm
Height 113 mm
Width --
Width (Slots) 2 PCIe-Slots
Weight --
Datos adicionales
Interfaz GPU PCIe 3.0 x 16
Fecha de lanzamiento Q3/2018
Precio de lanzamiento --
Tamaño de la estructura 12 nm
Part-no N208T1-11D6-1150022

Cinebench R11.5, 64bit (iGPU, OpenGL)

33% Complete
33% Complete
33% Complete
33% Complete

Geekbench 3, 64bit (Single-Core)

67% Complete
67% Complete
67% Complete
67% Complete

Geekbench 3, 64bit (Single-Core)

55% Complete
54% Complete
54% Complete
54% Complete

Cinebench R11.5, 64bit (Multi-Core)

66% Complete
66% Complete
INNO3D GeForce RTX 2080 Ti JET 78 fps (avg) (66%)
66% Complete
66% Complete
66% Complete

Cinebench R11.5, 64bit (Multi-Core)

68% Complete
ASUS Turbo GeForce RTX 2080 Ti 136 fps (avg) (68%)
68% Complete
INNO3D GeForce RTX 2080 Ti JET 135 fps (avg) (67%)
67% Complete
MSI GeForce RTX 2080 Ti Duke 11G 135 fps (avg) (67%)
67% Complete
MSI GeForce RTX 2080 Ti Ventus GP 135 fps (avg) (67%)
67% Complete

Cinebench R11.5, 64bit (Multi-Core)

94% Complete
94% Complete
INNO3D GeForce RTX 2080 Ti JET 188 fps (avg) (93%)
93% Complete
ASUS ROG Strix GeForce RTX 3080 188 fps (avg) (93%)
93% Complete
93% Complete

Geekbench 3, 64bit (Multi-Core)

57% Complete
57% Complete
INNO3D GeForce RTX 2080 Ti JET 54 fps (avg) (56%)
56% Complete
56% Complete
56% Complete

Geekbench 3, 64bit (Multi-Core)

ASUS Dual GeForce RTX 2080 Ti 103 fps (avg) (65%)
65% Complete
65% Complete
INNO3D GeForce RTX 2080 Ti JET 102 fps (avg) (65%)
65% Complete
MSI GeForce RTX 2080 Ti Duke 11G 102 fps (avg) (65%)
65% Complete
MSI GeForce RTX 2080 Ti Ventus GP 102 fps (avg) (65%)
65% Complete

Geekbench 3, 64bit (Multi-Core)

72% Complete
INNO3D GeForce RTX 2080 Ti JET 143 fps (avg) (71%)
71% Complete
ASUS Dual GeForce RTX 2080 Ti 143 fps (avg) (71%)
71% Complete
71% Complete

Estimated results for PassMark CPU Mark

50% Complete
50% Complete
49% Complete
49% Complete
49% Complete

Cinebench R20 (Single-Core)

44% Complete
44% Complete
44% Complete
44% Complete
44% Complete

Cinebench R15 (Single-Core)

69% Complete
67% Complete
67% Complete
67% Complete

Cinebench R15 (Multi-Core)

44% Complete
44% Complete
44% Complete
AMD Radeon RX 6800 0.85 MH/s (44%)
44% Complete
44% Complete

Buy INNO3D GeForce RTX 2080 Ti JET

Comparaciones populares

1. INNO3D GeForce RTX 2080 Ti JET MSI GeForce RTX 3060 Ti Ventus 2X 8G INNO3D GeForce RTX 2080 Ti JET vs MSI GeForce RTX 3060 Ti Ventus 2X 8G
2. Colorful iGame GeForce RTX 3080 Ultra OC 10G-V INNO3D GeForce RTX 2080 Ti JET Colorful iGame GeForce RTX 3080 Ultra OC 10G-V vs INNO3D GeForce RTX 2080 Ti JET
3. INNO3D GeForce RTX 2080 Ti JET EVGA GeForce RTX 3070 XC3 Black Gaming INNO3D GeForce RTX 2080 Ti JET vs EVGA GeForce RTX 3070 XC3 Black Gaming
4. ZOTAC GAMING GeForce RTX 3070 Ti Trinity OC INNO3D GeForce RTX 2080 Ti JET ZOTAC GAMING GeForce RTX 3070 Ti Trinity OC vs INNO3D GeForce RTX 2080 Ti JET
5. ASRock Radeon RX 5700 XT Challenger D 8G OC INNO3D GeForce RTX 2080 Ti JET ASRock Radeon RX 5700 XT Challenger D 8G OC vs INNO3D GeForce RTX 2080 Ti JET
6. INNO3D GeForce RTX 2080 Ti JET Gainward GeForce RTX 3060 Ti Ghost V1 LHR INNO3D GeForce RTX 2080 Ti JET vs Gainward GeForce RTX 3060 Ti Ghost V1 LHR
7. INNO3D GeForce RTX 2080 Ti JET Colorful GeForce GTX 1650 4G-V INNO3D GeForce RTX 2080 Ti JET vs Colorful GeForce GTX 1650 4G-V
8. ASUS Dual GeForce RTX 3060 OC Edition INNO3D GeForce RTX 2080 Ti JET ASUS Dual GeForce RTX 3060 OC Edition vs INNO3D GeForce RTX 2080 Ti JET
9. MSI Radeon RX 5700 XT Gaming X INNO3D GeForce RTX 2080 Ti JET MSI Radeon RX 5700 XT Gaming X vs INNO3D GeForce RTX 2080 Ti JET
10. INNO3D GeForce RTX 2080 Ti JET EVGA GeForce RTX 2060 SUPER SC ULTRA GAMING INNO3D GeForce RTX 2080 Ti JET vs EVGA GeForce RTX 2060 SUPER SC ULTRA GAMING
11. INNO3D GeForce RTX 2080 Ti JET MSI GeForce RTX 3060 GAMING X Trio 12G INNO3D GeForce RTX 2080 Ti JET vs MSI GeForce RTX 3060 GAMING X Trio 12G
12. Colorful iGame GeForce RTX 2080 Advanced OC V3-V INNO3D GeForce RTX 2080 Ti JET Colorful iGame GeForce RTX 2080 Advanced OC V3-V vs INNO3D GeForce RTX 2080 Ti JET
13. MSI GeForce RTX 3060 Ti Ventus 2X 8G OC INNO3D GeForce RTX 2080 Ti JET MSI GeForce RTX 3060 Ti Ventus 2X 8G OC vs INNO3D GeForce RTX 2080 Ti JET
14. INNO3D GeForce RTX 2080 Ti JET GIGABYTE GeForce RTX 2080 Ti Windforce OC 11G INNO3D GeForce RTX 2080 Ti JET vs GIGABYTE GeForce RTX 2080 Ti Windforce OC 11G
15. INNO3D GeForce RTX 3070 iCHILL X3 INNO3D GeForce RTX 2080 Ti JET INNO3D GeForce RTX 3070 iCHILL X3 vs INNO3D GeForce RTX 2080 Ti JET
16. ASRock Radeon RX 6700 XT Phantom Gaming D 12GB OC INNO3D GeForce RTX 2080 Ti JET ASRock Radeon RX 6700 XT Phantom Gaming D 12GB OC vs INNO3D GeForce RTX 2080 Ti JET
17. ASRock Radeon RX 6600 XT Challenger Pro 8GB OC INNO3D GeForce RTX 2080 Ti JET ASRock Radeon RX 6600 XT Challenger Pro 8GB OC vs INNO3D GeForce RTX 2080 Ti JET
18. MSI GeForce RTX 3090 Suprim X 24G INNO3D GeForce RTX 2080 Ti JET MSI GeForce RTX 3090 Suprim X 24G vs INNO3D GeForce RTX 2080 Ti JET
19. INNO3D GeForce RTX 2080 Ti JET GALAX GeForce RTX 3070 EX Gamer (1-Click OC) INNO3D GeForce RTX 2080 Ti JET vs GALAX GeForce RTX 3070 EX Gamer (1-Click OC)
INNO3D GeForce RTX 2080 Ti JET - GPU Specs & Benchmarks
4.7 of 36 rating(s)
back to top