|
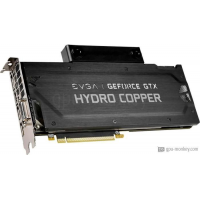
EVGA GeForce GTX 1080 Ti SC Hydro Copper GAMING
EVGA GeForce GTX 1080 Ti SC Hydro Copper GAMING lanciato Q1/2017 , che si basa sull'architettura NVIDIA GeForce GTX 1080 Ti . Verrà con 11 GB di memoria GDDR5X alta larghezza di banda.EVGA GeForce GTX 1080 Ti SC Hydro Copper GAMING presenta 3584 shader, 88 rende le unità di output, ha un boost clock di 1.670 GHz+ 6 % ed è dotato di un 250 W . La GPU supporta fino a 4 monitor con risoluzioni di 7680x4320 . Inoltre, se stai cercando un Water cooling raffreddamento -- e un tipo di ventola --, sarebbe la scelta migliore. |
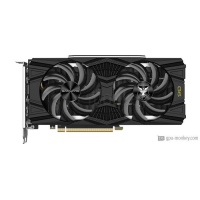
Gainward GeForce RTX 2060 SUPER Phoenix
Gainward GeForce RTX 2060 SUPER Phoenix lanciato Q3/2019 , che si basa sull'architettura NVIDIA GeForce RTX 2060 SUPER . Verrà con 8 GB di memoria GDDR6 alta larghezza di banda.Gainward GeForce RTX 2060 SUPER Phoenix presenta 2176 shader, 64 rende le unità di output, ha un boost clock di 1.650 GHz ed è dotato di un 175 W . La GPU supporta fino a 4 monitor con risoluzioni di 7680x4320 . Inoltre, se stai cercando un Air cooling raffreddamento Axial e un tipo di ventola Axial, sarebbe la scelta migliore. |
|
GPU |
||
| NVIDIA GeForce GTX 1080 Ti | Based on | NVIDIA GeForce RTX 2060 SUPER |
| GP102-350-K1-A1 | GPU Chip | TU106 |
| 28 | Unità di esecuzione | 34 |
| 3584 | Ombreggiatore | 2176 |
| 88 | Render Output Units | 64 |
| 224 | Texture Units | 136 |
Memory |
||
| 11 GB | Memory Size | 8 GB |
| GDDR5X | Memory Type | GDDR6 |
| 1.376 GHz | Memory Speed | 1.75 GHz |
| 484 GB/s | Memory Bandwith | 448 GB/s |
| 352 bit | Memory Interface | 256 bit |
Clock Speeds |
||
1.556 GHz + 5 % + 5 % |
Base Clock | 1.470 GHz |
| 1.670 GHz+ 6 % |
Boost Clock | 1.650 GHz |
| Avg (Game) Clock | ||
|
Yes |
Overclocking |
Yes |
Thermal Design |
||
| 250 W | TDP | 175 W |
| -- | TDP (up) | -- |
| -- | Tjunction max | -- |
| 1 x 6-Pin, 1 x 8-Pin | PCIe-Power | 1 x 8-Pin |
Cooler & Fans |
||
| -- | Fan-Type | Axial |
| -- | Fan 1 | 2 x 90 mm |
| -- | Fan 2 | -- |
| Water cooling | Cooler-Type | Air cooling |
| 0 dB / Silent | Noise (Idle) | 0 dB / Silent |
| 0 dB | Noise (Load) | -- |
Connectivity |
||
| 4 | Max. Displays | 4 |
| 2.2 | HDCP-Version | 2.2 |
| 1x HDMI v2.0b | HDMI Ports | 1x HDMI v2.0b |
| 3x DP v1.4 | DP Ports | 3x DP v1.4a |
| 1 | DVI Ports | -- |
| -- | VGA Ports | -- |
| -- | USB-C Ports | -- |
Featureset |
||
| 7680x4320 | Max. resolution | 7680x4320 |
| 12_1 | DirectX | 12_2 |
| No |
Raytracing | Yes |
| No |
DLSS / FSR | Yes} |
| No LED lighting | LED | No LED lighting |
Supported Video Codecs |
||
| Decode / Encode | h264 | Decode / Encode |
| Decode / Encode | h265 / HEVC | Decode / Encode |
| No |
AV1 | No |
| Decode | VP8 | Decode |
| Decode | VP9 | Decode |
Dimensions |
||
| 267 mm | Length | 235 mm |
| 129 mm | Height | 112 mm |
| -- | Width | -- |
| 2 PCIe-Slots | Width (Slots) | 2 PCIe-Slots |
| -- | Weight | -- |
| PCIe 3.0 x 16 | Interfaccia GPU | PCIe 3.0 x 16 |
Additional data |
||
| 11G-P4-6399-KR | Part-no | 471056224-1105 |
| Q1/2017 | Data di rilascio | Q3/2019 |
| -- | Prezzo di rilascio | -- |
| 16 nm | Dimensioni della struttura | 12 nm |
| data sheet | Documents | data sheet |