GET FREE $100 Welcome Offer
BUY AND SELL BTC, BNB, CAKE, DOGE, ETH AND 27 MORE
BUY AND SELL BTC,
BNB, CAKE, DOGE
ETH AND 27 MORE

Gainward GeForce RTX 2080 Phoenix - Benchmark, test di confronto e specifiche


Gainward GeForce RTX 2080 Phoenix

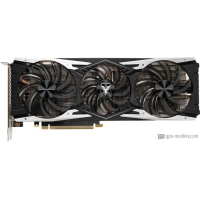
Gainward GeForce RTX 2080 Phoenix lanciato , che si basa sull'architettura NVIDIA GeForce RTX 2080 . Verrà con 8 GB di memoria GDDR6 alta larghezza di banda.Gainward GeForce RTX 2080 Phoenix presenta 2944 shader, 64 rende le unità di output, ha un boost clock di 1.740 GHz+ 2 % ed è dotato di un 215 W . La GPU supporta fino a 4 monitor con risoluzioni di 7680x4320 . Inoltre, se stai cercando un Air cooling raffreddamento Axial e un tipo di ventola Axial, sarebbe la scelta migliore.

GPU and Memory GPU and Memory
Based on NVIDIA GeForce RTX 2080 Memory Size 8 GB
GPU Chip TU104 Memory Type GDDR6
Unità di esecuzione 46 Memory Speed 1.75 GHz
Ombreggiatore 2944 Memory Bandwith 448 GB/s
Render Output Units 64 Memory Interface 256 bit
Texture Units 184
Supporto per codec hardware Supporto per codec hardware
H264 Decode / Encode
H265 / HEVC (8 bit)
H265 / HEVC (10 bit)
VP8 Decode
VP9 Decode
AV1 No
AV1 No
AVC
JPEG
Velocità dell'orologio
Base Clock 1.515 GHz
Boost Clock 1.740 GHzDeviation vs GPU group+ 2 %
Avg (Game) Clock 1.710 GHz
Overclocking Yes check

Progettazione termica
TDP 215 W
TDP (up) --
Tjunction max 89 °C
PCIe-Power 1 x 6-Pin, 1 x 8-Pin
Dispositivo di raffreddamento e ventole
Fan-Type Axial Cooler-Type Air cooling
Fan 1 2 x 90 mm Noise (Idle) --
Fan 2 1 x 80 mm Noise (Load): --
Connettività
Max. Displays 4
HDCP-Version 2.2
HDMI Ports 1x HDMI v2.0b
DP Ports 3x DP v1.4a
DVI Ports --
VGA Ports --
USB-C Ports 1
Funzionalità
Max. resolution 7680x4320
DirectX 12_2
Raytracing Yes check
DLSS / FSR Yes check
LED No LED lighting
Codec video supportati
h264 Decode / Encode VP8 Decode
h265 / HEVC Decode / Encode VP9 Decode
AV1 No uncheck Noise (Load): --
Dimensioni
Length 292 mm
Height 112 mm
Width --
Width (Slots) 2 PCIe-Slots
Weight --
Dati aggiuntivi
Interfaccia GPU PCIe 3.0 x 16
Data di rilascio Q3/2018
Prezzo di rilascio --
Dimensioni della struttura 12 nm
Part-no 426018336-4139

Cinebench R11.5, 64bit (iGPU, OpenGL)

26% Complete
26% Complete
25% Complete
25% Complete
25% Complete

Geekbench 3, 64bit (Single-Core)

53% Complete
53% Complete
53% Complete
53% Complete
53% Complete

Geekbench 3, 64bit (Single-Core)

44% Complete
43% Complete
43% Complete
43% Complete

Cinebench R11.5, 64bit (Multi-Core)

52% Complete
52% Complete
51% Complete
ASUS Dual GeForce RTX 2080 Evo 61 fps (avg) (51%)
51% Complete
ASUS Turbo GeForce RTX 2080 Evo 61 fps (avg) (51%)
51% Complete

Cinebench R11.5, 64bit (Multi-Core)

56% Complete
56% Complete
Gainward GeForce RTX 2080 Phoenix 112 fps (avg) (56%)
56% Complete
ASUS Dual GeForce RTX 2080 Evo 112 fps (avg) (56%)
56% Complete
ASUS Turbo GeForce RTX 2080 Evo 112 fps (avg) (56%)
56% Complete

Cinebench R11.5, 64bit (Multi-Core)

78% Complete
78% Complete
Gainward GeForce RTX 2080 Phoenix 156 fps (avg) (77%)
77% Complete
ASUS Dual GeForce RTX 2080 Evo 156 fps (avg) (77%)
77% Complete
ASUS Turbo GeForce RTX 2080 Evo 156 fps (avg) (77%)
77% Complete

Geekbench 3, 64bit (Multi-Core)

47% Complete
47% Complete
46% Complete
46% Complete
46% Complete

Geekbench 3, 64bit (Multi-Core)

53% Complete
53% Complete
53% Complete
ASUS Dual GeForce RTX 2080 Evo 83 fps (avg) (53%)
53% Complete
ASUS Turbo GeForce RTX 2080 Evo 83 fps (avg) (53%)
53% Complete

Geekbench 3, 64bit (Multi-Core)

PNY GeForce RTX 2080 SUPER Blower 127 fps (avg) (63%)
63% Complete
63% Complete
Gainward GeForce RTX 2080 Phoenix 126 fps (avg) (63%)
63% Complete
63% Complete
63% Complete

Estimated results for PassMark CPU Mark

36% Complete
36% Complete
35% Complete

Cinebench R20 (Single-Core)

30% Complete
30% Complete
29% Complete
29% Complete
29% Complete

Cinebench R15 (Single-Core)

57% Complete
57% Complete
55% Complete
55% Complete
55% Complete

Cinebench R15 (Multi-Core)

31% Complete
31% Complete
31% Complete
31% Complete
31% Complete

Buy Gainward GeForce RTX 2080 Phoenix

Confronti popolari

1. Gainward GeForce RTX 2080 Phoenix Colorful iGame GeForce RTX 3090 Kudan-V Gainward GeForce RTX 2080 Phoenix vs Colorful iGame GeForce RTX 3090 Kudan-V
2. KFA2 GeForce RTX 2060 PLUS (1-Click OC) Gainward GeForce RTX 2080 Phoenix KFA2 GeForce RTX 2060 PLUS (1-Click OC) vs Gainward GeForce RTX 2080 Phoenix
3. GIGABYTE AORUS GeForce RTX 2080 SUPER Waterforce 8G Gainward GeForce RTX 2080 Phoenix GIGABYTE AORUS GeForce RTX 2080 SUPER Waterforce 8G vs Gainward GeForce RTX 2080 Phoenix
4. PNY GeForce RTX 3090 24GB XLR8 Gaming REVEL EPIC-X RGB Gainward GeForce RTX 2080 Phoenix PNY GeForce RTX 3090 24GB XLR8 Gaming REVEL EPIC-X RGB vs Gainward GeForce RTX 2080 Phoenix
5. NVIDIA GeForce RTX 3080 Laptop (Mobile) - 125 W Gainward GeForce RTX 2080 Phoenix NVIDIA GeForce RTX 3080 Laptop (Mobile) - 125 W vs Gainward GeForce RTX 2080 Phoenix
6. Gainward GeForce RTX 2080 Phoenix MSI GeForce RTX 3070 Ti GAMING X TRIO 8G Gainward GeForce RTX 2080 Phoenix vs MSI GeForce RTX 3070 Ti GAMING X TRIO 8G
Gainward GeForce RTX 2080 Phoenix - GPU Specs & Benchmarks
4.9 of 38 rating(s)
back to top