GET FREE $100 Welcome Offer
BUY AND SELL BTC, BNB, CAKE, DOGE, ETH AND 27 MORE
BUY AND SELL BTC,
BNB, CAKE, DOGE
ETH AND 27 MORE

Gainward GeForce RTX 2080 - ベンチマーク、比較テスト、および仕様


Gainward GeForce RTX 2080

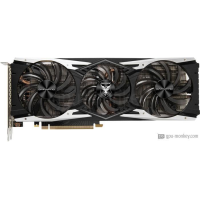
Gainward GeForce RTX 2080起動に基づいており、 NVIDIA GeForce RTX 2080アーキテクチャ。それは付属しています8 GB高帯域幅のGDDR6メモリ。Gainward GeForce RTX 2080機能の2944シェーダー、 64レンダー出力ユニットは、 1.710 GHz 215 W消費電力を備えています。 GPUは、解像度が7680x4320 4モニターをサポートします。 Air coolingクーラーとAxialファンタイプを探している場合は、それが最良の選択です。

GPU and Memory GPU and Memory
Based on NVIDIA GeForce RTX 2080 Memory Size 8 GB
GPU Chip TU104 Memory Type GDDR6
実行ユニット 46 Memory Speed 1.75 GHz
シェーダー 2944 Memory Bandwith 448 GB/s
Render Output Units 64 Memory Interface 256 bit
Texture Units 184
ハードウェアコーデックのサポート ハードウェアコーデックのサポート
H264 Decode / Encode
H265 / HEVC (8 bit)
H265 / HEVC (10 bit)
VP8 Decode
VP9 Decode
AV1 No
AV1 No
AVC
JPEG
クロック速度
Base Clock 1.515 GHz
Boost Clock 1.710 GHz
Avg (Game) Clock
オーバークロック Yes check

熱設計
TDP 215 W
TDP (up) --
Tjunction max 89 °C
PCIe-Power 1 x 6-Pin, 1 x 8-Pin
クーラー&ファン
Fan-Type Axial Cooler-Type Air cooling
Fan 1 2 x 90 mm Noise (Idle) --
Fan 2 1 x 80 mm Noise (Load): --
接続性
Max. Displays 4
HDCP-Version 2.2
HDMI Ports 1x HDMI v2.0b
DP Ports 3x DP v1.4a
DVI Ports --
VGA Ports --
USB-C Ports 1
機能セット
Max. resolution 7680x4320
DirectX 12_2
Raytracing Yes check
DLSS / FSR Yes check
LED No LED lighting
サポートされているビデオコーデック
h264 Decode / Encode VP8 Decode
h265 / HEVC Decode / Encode VP9 Decode
AV1 No uncheck Noise (Load): --
寸法
Length 292 mm
Height 112 mm
Width --
Width (Slots) 2 PCIe-Slots
Weight --
追加データ
GPUインターフェース PCIe 3.0 x 16
発売日 Q3/2018
発売価格 --
構造サイズ 12 nm
Part-no 426018336-4207

Cinebench R11.5, 64bit (iGPU, OpenGL)

25% Complete
25% Complete
25% Complete
25% Complete
25% Complete

Geekbench 3, 64bit (Single-Core)

53% Complete
53% Complete
53% Complete
53% Complete
53% Complete

Geekbench 3, 64bit (Single-Core)

43% Complete
43% Complete
43% Complete
43% Complete

Cinebench R11.5, 64bit (Multi-Core)

52% Complete
52% Complete
Gainward GeForce RTX 2080 61 fps (avg) (51%)
51% Complete
ASUS Dual GeForce RTX 2080 Evo 61 fps (avg) (51%)
51% Complete
ASUS Turbo GeForce RTX 2080 Evo 61 fps (avg) (51%)
51% Complete

Cinebench R11.5, 64bit (Multi-Core)

56% Complete
56% Complete
Gainward GeForce RTX 2080 112 fps (avg) (56%)
56% Complete
ASUS Dual GeForce RTX 2080 Evo 112 fps (avg) (56%)
56% Complete
ASUS Turbo GeForce RTX 2080 Evo 112 fps (avg) (56%)
56% Complete

Cinebench R11.5, 64bit (Multi-Core)

ASUS Dual GeForce RTX 2080 Evo 156 fps (avg) (77%)
77% Complete
ASUS Turbo GeForce RTX 2080 Evo 156 fps (avg) (77%)
77% Complete
Gainward GeForce RTX 2080 155 fps (avg) (77%)
77% Complete
MSI GeForce RTX 2080 Ventus 8G V2 155 fps (avg) (77%)
77% Complete
ASUS Dual GeForce RTX 2080 155 fps (avg) (77%)
77% Complete

Geekbench 3, 64bit (Multi-Core)

47% Complete
47% Complete
Gainward GeForce RTX 2080 44 fps (avg) (46%)
46% Complete
46% Complete
46% Complete

Geekbench 3, 64bit (Multi-Core)

ASUS Dual GeForce RTX 2080 Evo 83 fps (avg) (53%)
53% Complete
ASUS Turbo GeForce RTX 2080 Evo 83 fps (avg) (53%)
53% Complete
Gainward GeForce RTX 2080 82 fps (avg) (52%)
52% Complete
ASUS Dual GeForce RTX 2080 82 fps (avg) (52%)
52% Complete
52% Complete

Geekbench 3, 64bit (Multi-Core)

63% Complete
63% Complete
Gainward GeForce RTX 2080 125 fps (avg) (62%)
62% Complete
MSI GeForce RTX 2080 Ventus 8G V2 125 fps (avg) (62%)
62% Complete
ASUS Dual GeForce RTX 2080 125 fps (avg) (62%)
62% Complete

Estimated results for PassMark CPU Mark

36% Complete
36% Complete
35% Complete

Cinebench R20 (Single-Core)

30% Complete
30% Complete
29% Complete
29% Complete
29% Complete

Cinebench R15 (Single-Core)

57% Complete
57% Complete
55% Complete
55% Complete
55% Complete

Cinebench R15 (Multi-Core)

31% Complete
31% Complete
Gainward GeForce RTX 2080 0.6 MH/s (31%)
31% Complete
31% Complete
31% Complete

Buy Gainward GeForce RTX 2080

人気のある比較

1. ASUS Phoenix GeForce GTX 1660 Gainward GeForce RTX 2080 ASUS Phoenix GeForce GTX 1660 vs Gainward GeForce RTX 2080
2. ASUS Phoenix GeForce GTX 1060 3GB Gainward GeForce RTX 2080 ASUS Phoenix GeForce GTX 1060 3GB vs Gainward GeForce RTX 2080
3. Gainward GeForce RTX 2080 INNO3D GeForce GTX 1650 SUPER COMPACT Gainward GeForce RTX 2080 vs INNO3D GeForce GTX 1650 SUPER COMPACT
4. Gainward GeForce RTX 2080 KFA2 GeForce RTX 2070 SUPER Work The Frames Edition Gainward GeForce RTX 2080 vs KFA2 GeForce RTX 2070 SUPER Work The Frames Edition
5. Gainward GeForce RTX 2080 ZOTAC Gaming GeForce RTX 3090 Trinity OC Gainward GeForce RTX 2080 vs ZOTAC Gaming GeForce RTX 3090 Trinity OC
6. MSI GeForce RTX 3070 Ventus 3X 8G OC Gainward GeForce RTX 2080 MSI GeForce RTX 3070 Ventus 3X 8G OC vs Gainward GeForce RTX 2080
7. ASUS Dual series GeForce GTX 1060 6GB Gainward GeForce RTX 2080 ASUS Dual series GeForce GTX 1060 6GB vs Gainward GeForce RTX 2080
8. Gainward GeForce RTX 2080 INNO3D GeForce GTX 1650 SUPER TWIN X2 OC Gainward GeForce RTX 2080 vs INNO3D GeForce GTX 1650 SUPER TWIN X2 OC
9. Gainward GeForce RTX 2080 PowerColor Hellhound Radeon RX 6700 XT Gainward GeForce RTX 2080 vs PowerColor Hellhound Radeon RX 6700 XT
10. Gainward GeForce RTX 2080 GALAX GeForce RTX 2070 SUPER Gainward GeForce RTX 2080 vs GALAX GeForce RTX 2070 SUPER
11. MSI GeForce GT 1030 2G LP OCV1 Gainward GeForce RTX 2080 MSI GeForce GT 1030 2G LP OCV1 vs Gainward GeForce RTX 2080
Gainward GeForce RTX 2080 - GPU Specs & Benchmarks
4.4 of 33 rating(s)
back to top